Funflix Data Pipeline
Data Modeling
Funflix's Medical division needs your help in getting some insights from their datasets. You have to perform the following steps:
Create a schema
funflix.Upload the 4 data files in this schema. Table names will be same as file names.
Create a star schema (Entity-Relation Diagram). Use https://dbdiagram.io/ to create it. Once created, export the diagram as png and save it as
erd.png.Write SQL queries to answer the following questions. For each of these queries, create a view in the same schema.
Query View name How many customers visited the clinic in february 2022? customer_feb22 What was the most booked service in march 2022? service_mar22 Who were the top-5 customers who visited the most in Q1 2022 (i.e. Jan-Mar 2022)? customer_top5_q122 What are the top-3 most booked services by the most visited customer? service_top3 Which therapist is most experienced in physiotherapy? therapist_experience Push the code changes to your branch.
Create PR and add the instructor and a peer for review.
Data Ingestion
You are working as a data engineer for an Australian media company Funflix. Customers comes to Funflix’s platform and subscribe to become a subscribed user. Funflix content experts then hand picks a collection of movies as per user’s taste and sends these recommendations to the user via email. Things are going well so far but Funflix’s executive team do not see potential growth into future with the existing IT arrangements and asked you to innovate their company’s IT processes to enable Funflix’s future growth.
Ele is Funflix’s IT expert and she knows all about the current systems and she is also your POC (point-of-contact) in this project. Here are the key points of the 1st meeting between you and Ele:
You: I would like to know about the state of data. How it looks, where it is, Who does what?
Ele: We have a user data in which we store our subscribers’ details, a movie data to store movie details and we also collect our user’s feedback on movies. All the data is in 3 files that we maintain in MS-Excel on our local server.
You: How can I get access this data?
Ele: I can email you these 3 files or share them via pen-drive? The file size is not much.
You: Okay, you can email them then.
You got the data via email and now it’s time to start the innovative work. You have to perform the following steps in oder to pass the test:
Creata a folder named {your name initials}-funflix, e.g. if your name is John Doe, folder would be
JD-funflix. (note: for following instructions, we will use this name as reference.)Save the files that you got via mail in
JD-funflix/data/raw/path.There is a redshift cluster running for you and database name is ‘
funflix’. The connection details are stored in this AWS secret -dev/detraining/redshift. So, establish a connection to the warehouse by first fetching the details from secrets manager and then connect to the redsift cluster. And don’t forget to setup your IAM credentials.Create a schema in the database. Schema name should be like
{your name initials}_raw.Setup the AWS Wrangler connection. Use the following connection details:
bucket = "funflix-de"
path = f"s3://{bucket}/{PREFIX.lower()}/stage/"
con = wr.redshift.connect("aws-data-wrangler-redshift")
Now, as you got 3 files in mail — for each file, do the following:
- Load into a dataframe (pandas or Pyspark dataframe e.g.)
- Add column names. You can find the list of columns here:
- cols
- ['userid','age','gender','occupation',"zipcode"]
- ["movieid", "movie_title", "release_date", "video_release_date", "imdb_url", "unknown", "action", "adventure", "animation", "children", "comedy", "crime", "documentary", "drama", "fantasy", "film_noir", "horror", "musical", "mystery", "romance", "scifi", "thriller", "war", "western"]
- ['userid','itemid','rating','timestamp']
- cols
- Push the dataframe to database with correct schema.
Go to RedShift query editor in AWS and verify if data has been updated corrrectly. e.g. In case of John Doe, it would look like this:

Add the code that you used to perform the above activity in a notebook here:
JD-funflix/nbs/01-JD-ingest.ipynb.Analyze the DDLs in Redshift and use this analysis to create a schema diagram (Entity-Relation Diagram). Use https://dbdiagram.io/ to create it. Once created, export the diagram as png and save it as
JD-funflix/img/er-diagram.png.Also share the above diagram as public URL and save this url in
JD-funflix/links/er-diagram-link.txt.Create a branch named
{your github id}/funflixin the de-ac-assignment-funflix repo and push the above changes in your branch’stests/funflixfolder. For instance, in case of John Doe, path will bedatalaker/de-ac-assignment-funflix/tests/funflix/JD-funflix/*. (note:*means all the files in that folder).Create PR and notify the instructor for review.
Multi-Region Data Pipeline
Step 1 - Read the hypothetical case to get context
An online retailer has a website where you can purchase widgets in a variety of colours. The website is backed by a relational database. Every transaction is stored in the database. How many blue widgets did the retailer sell in the last quarter?
To answer this question, you could run a SQL query on the database. This doesn't rise to the level of needing a data engineer. But as the site grows, running queries on the production database is no longer practical. Furthermore, there may be more than one database that records transactions. There may be a database at different geographical locations – for example, the retailers in North America may have a different database than the retailers in Asia, Africa, and Europe.
Now you have entered the realm of data engineering. To answer the preceding question, a data engineer would create connections to all of the transactional databases for each region, extract the data, and load it into a data warehouse. From there, you could now count the number of all the blue widgets sold.
Rather than finding the number of blue widgets sold, companies would prefer to find the answer to the following questions:
- How do we find out which locations sell the most widgets?
- How do we find out the peak times for selling widgets?
- How many users put widgets in their carts and remove them later?
- How do we find out the combinations of widgets that are sold together?
Answering these questions requires more than just extracting the data and loading it into a single system. There is a transformation required in between the extract and load. There is also the difference in times zones in different regions. For instance, the United States alone has four time zones. Because of this, you would need to transform time fields to a standard. You will also need a way to distinguish sales in each region. This could be accomplished by adding a location field to the data. Should this field be spatial – in coordinates or as well-known text – or will it just be text that could be transformed in a data engineering pipeline?
Here, the data engineer would need to extract the data from each database, then transform the data by adding an additional field for the location. To compare the time zones, the data engineer would need to be familiar with data standards. For the time, the International Organization for Standardization (ISO) has a standard – ISO 8601.
Let's now answer the questions in the preceding list one by one:
- Extract the data from each database.
- Add a field to tag the location for each transaction in the data.
- Transform the date from local time to ISO 8601.
- Load the data into the data warehouse.
The combination of extracting, loading, and transforming data is accomplished by the creation of a data pipeline. The data comes into the pipeline raw, or dirty in the sense that there may be missing data or typos in the data, which is then cleaned as it flows through the pipe. After that, it comes out the other side into a data warehouse, where it can be queried. The following diagram shows the pipeline required to accomplish the task:
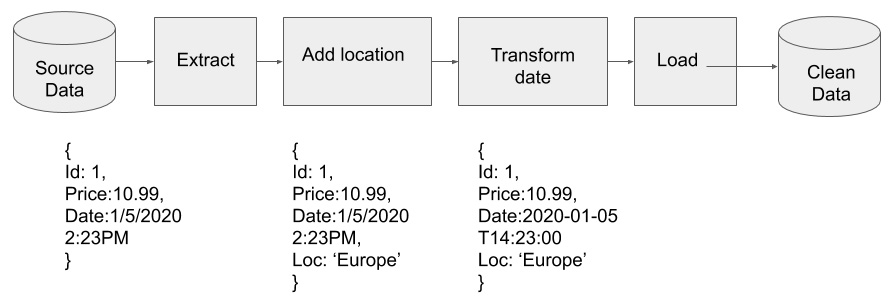
A pipeline that adds a location and modifies the date.
Step 2 - Read the assignment and solve it
Funflix runs its business globally in two regions - American and European. Mitch is the Sales Head of American region and Shiva is Sales Head of European region. Funflix needs your help in doing something similar to the above use case (the reading material) to collect their data from these regions and load them in their Warehouse. They also expecting to get some answers related to their overall sales that Mitch and Shiva can not answer at the moment because they don’t have the global data. (💡 Data is in Silos!).
Mitch shared the amarican region data:
Shiva on the other hand wants you to pull the data directly from the database. The credentials are in the AWS Secret Manager named dev/detraining/rdspostgres. Data path is funflix.public.fnflx_sales_eu.
You got the data related information and now it’s time to start the work. You have to perform the following steps in oder to pass the test:
Creata a folder named {your name initials}-funflix, e.g. if your name is John Doe, folder would be
JD-funflix. (note: for following instructions, we will use this name as reference.)Pull the data for both regions and store in
JD-funflix/data/raw/{region}path.There is a Redshift cluster running for you. Use AWS secret -
dev/detraining/redshiftto connect to itsfunflixdatabase and create a schema in the database. Schema name should be like{your name initials}_refined. If schema is already there, then do not create it again. Use the existing one.Setup the AWS Wrangler connection. Use the following connection details:
bucket = "funflix-de"
path = f"s3://{bucket}/{PREFIX.lower()}/stage/"
con = wr.redshift.connect("aws-data-wrangler-redshift")
It’s time to follow the instructions that you read during the case study and apply them here. To summarize those again, this is what you need to do:
- Read the data from raw layer for both regions in separate tables.
- Add a field to tag the location for each transaction in the data.
- Transform the date from local time to ISO 8601.
- Merge the data into a single table named
sales. - Load the data into the data warehouse.
The combination of extracting, loading, and transforming data is accomplished by the creation of a data pipeline. The data comes into the pipeline raw, or dirty in the sense that there may be missing data or typos in the data, which is then cleaned as it flows through the pipe. After that, it comes out the other side into a data warehouse, where it can be queried. The following diagram shows the pipeline required to accomplish the task:
A pipeline that adds a location and modifies the date.
Go to DBeaver, setup the warehouse connection and verify if data has been updated corrrectly.
Add the code that you used to perform the above activity in a notebook here:
JD-funflix/nbs/02-JD-load-sales.ipynb.Create a branch named
{your github id}/funflix-salesin the de-ac-assignment-funflix repo and push the above changes in your branch’stests/funflixfolder. For instance, in case of John Doe, path will bedatalaker/de-ac-assignment-funflix/tests/funflix/JD-funflix/*. (note:*means all the files in that folder).Create PR and notify the instructor for review.
Follow this link for more information.